 Skip to Content
How Much Would Your SSDI or SSA Check be in 2023?
COLAnow is your fastest Cost of Living Adjustment 2023 tracker because we look at high frequency data every week! Get a more accurate estimate for your 2023 Social Security benefits (SSDI & SSA Retirement), Federal Employees Retirement System (FERS) benefits, Veterans’ Benefits (VA Pension & Disability), and many other State, City, County and Company Pensions.
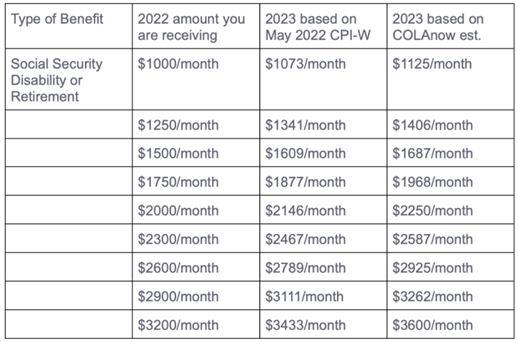
2023 SSDI or SSA benefit calculator
How much would your SSDI check or SSA retirement check be in 2023 if the COLAnow estimate of 12.50% is right vs. if the CPI-W stayed exactly the same?
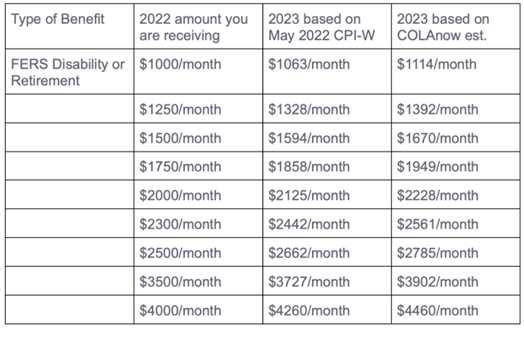
2023 FERS benefit calculator
How much would your FERS Disability or FERS Retirement check be in 2023 if the COLAnow estimate of 11.50% is right vs. if the CPI-W stayed exactly the same?
How Did We Calculate the 2023 COLAnow?
COLAnow as of 6/29/22: COLAnow is projecting a 12.50% Cost of Living Increase (COLA) beginning January 2023 for Social Security Disability beneficiaries and a 11.50% COLA increase for FERS Disability beneficiaries beginning in January 2023. We have shaved half a percentage point off of our projections from last week
The CPI-W was released Friday, June 10, 2022 and resulted in 7.3 percent increase from 3rd Quarter 2021’s average CPI-W, resulting in a 7.3 percent raise in Social Security benefits if prices stayed the same for the next 3 months. FERS Disability beneficiaries would get a 6.3 percent increase under the same scenario.
CPI-W Component Spotlight: Gas Prices are Astronomical
Gas prices account for about 6% of the CPI-W and unfortunately you will not see relief this summer because refineries are running hot! Any kind of disruption to refineries, such as a work stoppage or hurricane, and prices will spike.
The EIA released its weekly supply report which dropped the bombshell that oil refineries were operating at an incredible 95 percent capacity producing 9.5 million barrels/day during the week ending June 24, 2022:
Well, there you have it folks: the reason that gas prices have dropped slightly. But don’t get used to it because that level of production is utterly unsustainable by most accounts and we haven’t even reached the 4th of July holiday yet. Estimated gasoline demand last week was 8.9 million barrels/day, which represents lessened demand from last year but only by 2.0%. 8.9 million barrels/day implied demand is rather low so watch out for price spikes if Americans start driving more.
CPI-W Component Spotlight: Rent and Homeowner Expense
Shelter, which accounts for approximately 30% of the CPI-W, should rise by at least 0.6% per month because rent increases from last year are baked into the BLS method of surveying shelter prices. Sources of rent inflation, such as Zumper and Apartments.com, have rent increasing 9-12% year over year. And CPI-W Shelter costs typically lag actually rent increases by 6-12 months.
CPI-W Component Spotlight: Food Prices
Food prices, which are approximately 14% of the CPI-W, are rising with no end in sight. According to non-BLS sources, such as https://datasembly.com/grocery-price-index/, grocery store prices have broadly risen by 15% or more in the last nine months.
CPI-W Component Spotlight: Goods like apparel, cars and medical items
Goods prices, which account for approximately 21% of the CPI-W, are starting to heat up. This includes new cars, used cars, clothing, and medical items, among others. The cost to produce these goods is rising so the prices are rising.
What Causes Inflation?
The simple answer is that there is either more money seeking a product or service than there was yesterday, or there are less products or services available but the same amount of money available to pay for them. Also, there can be a combination of those two things. Here’s are two examples from the gas price data above:
Less supply: Hurricane Vladimir hits the Gulf Coast, shutting down refineries in Texas and Louisiana. Gasoline output falls from 9.5 million barrels a day to 7 million barrels a day. Americans keep driving the same amount, using 8.9 million barrels a day of gas. Prices rise from about $5/gallon to $6/gallon because there is less supply (refineries) and the same amount of demand (drivers).
More demand: Hurricane Vladimir misses the Gulf Coast, so gasoline output stays at 9.5 million barrels a day. Americans decide they all want to go see Mount Rushmore at the same time, using a record 11.5 million barrels a day of gas to do so. Prices rise from about $5/gallon to $6/gallon because there is the same amount of supply (refineries) but much more demand (drivers).